November 10, 2026
South Africa’s third-quarter 2026 employment figures offer a mixed picture: Manufacturing and Mining added jobs, and employment rose in several provinces, yet unemployment continued to climb and came in well above market expectations. With the working-age population also growing and global trade tensions, Middle East conflict and uncertainty over AGOA adding to the pressure, the latest data raise important questions about the pace and sustainability of job creation. Read the full report for a closer look at what’s driving the numbers, and which sectors and provinces may be most exposed.

Employment Statistics in South Africa: 2026Q3

Quarterly Labour Force Survey review · Source: Stats SA QLFS

33.7%Unemployment rate (Q2: 33.6%; consensus: 32.5%)
44.0%Expanded unemployment rate (Q2: 43.8%)
+106 000Jobs added, to about 16.8 million employed
8.57mUnemployed people (+97 000)

The employment statistics for the third quarter of 2026 once again painted a sombre picture in some sectors, with job growth remaining constrained. However, Manufacturing and Mining added 31,000 and 33,000 jobs respectively. This is welcome news, given South Africa’s strained relationship with the US, one of its largest export markets, and the country’s expected loss of access to the AGOA initiative from 1 January 2027.

The unemployment rate rose from 33.6% in the second quarter to 33.7% in the third quarter of 2026, exceeding market expectations of 32.5%. The expanded unemployment rate also increased, from 43.8% to 44.0%.
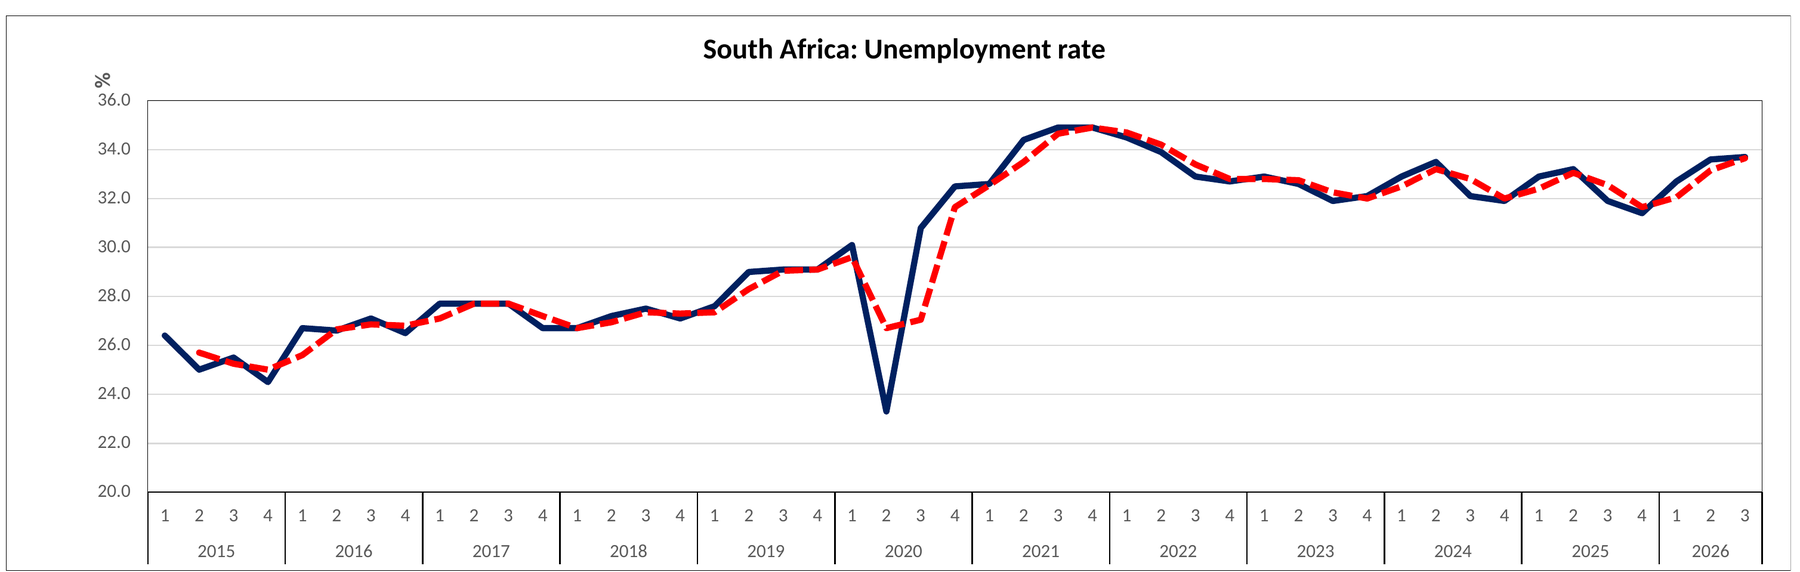
Line chart of South Africa's quarterly unemployment rate from 2015 to 2026Q3, rising from about 26% to a peak near 35% in 2021 and standing at 33.7% in 2026Q3
South Africa: unemployment rate (%), 2015Q1–2026Q3. Source: Stats SA QLFS

Total employment in South Africa increased by approximately 106,000 to an estimated 16.8 million in the third quarter. At the same time, the number of unemployed people rose by around 97,000, bringing the total to approximately 8.57 million. The working-age population grew by about 117,000 in the quarter, matching the increase recorded in the previous quarter and representing growth of roughly 0.3%.

Employment increased in the North West (+45,000), Gauteng (+25,000), Western Cape (+48,000) and Eastern Cape (+36,000). Decreases were recorded in the Free State (−34,000) and Mpumalanga (−30,000).

Employment by major sector

Employment by major sector (thousands)
QuarterTransportConstructionManufacturingFinanceTradeCommunity and social services
2020Q19951 3431 7062 5173 3203 759
2020Q28851 0661 4562 2342 9463 244
2020Q38781 0801 4602 4343 0083 381
2020Q49431 1661 4912 3123 0633 551
2021Q19031 0791 4972 5272 9793 567
2021Q29691 2221 4152 2483 0873 401
2021Q39641 1571 4022 3862 7783 191
2021Q49511 1331 3162 4042 8963 264
2022Q19601 0731 5792 3322 9943 546
2022Q29061 1771 5072 4603 1633 821
2022Q39391 2231 6302 3803 2453 849
2022Q49821 2121 6562 4843 2973 727
2023Q19921 2011 6542 6673 2693 902
2023Q29861 3041 5582 5993 3613 965
2023Q39661 3571 5082 8363 3904 084
2023Q41 0231 3221 5072 9643 3623 913
2024Q11 0621 2151 6062 9143 4713 791
2024Q21 0641 2041 6552 9053 3603 827
2024Q31 0471 3811 6352 7163 4694 021
2024Q41 0641 3591 6752 9483 4213 959
2025Q11 1311 2401 6773 0083 2283 914
2025Q21 1151 2591 6722 9833 3153 872
2025Q31 1131 3901 6102 9303 4243 988
2025Q41 1401 4251 5482 9623 3264 034
2026Q11 1111 3141 5872 9393 3203 828
2026Q21 1081 3541 5712 9503 3893 771
2026Q31 1241 3451 6043 0623 3913 792

Source: Stats SA QLFS

Outlook

Overall, the figures are sombre: the unemployment rate was notably higher than consensus forecasts, despite job gains in several sectors and provinces. This reflects the number of jobs created relative to growth in the working-age population. Discouraged workers are excluded from the unemployment rate calculation.

Ongoing international uncertainty, including the US tariff dispute with China and other countries, conflict in the Middle East, and concerns about the future of the AGOA agreement beyond the 1 January 2027 deadline, particularly South Africa’s exclusion, is likely to weigh on economic activity and job creation in the short to medium term. The Western Cape may be especially affected because of its exports to the US market. The US administration’s stance towards South Africa is also creating growing challenges for the province, as reflected in the latest employment figures.


More Coverage

Why Stats SA’s Q3 Employment Rebound Masks an Escalating Rural and Informal Crisis While Statistics South Africa’s Q3:2026 Quarterly Labour Force Survey reports an apparent rebound of 101,000 in total employment driven by resilient formal corporate hiring (+268,000, led by finance, manufacturing, and mining), this headline growth conceals a severe structural divergence. Official unemployment rose to 33.7%, drastically missing consensus expectations of 32.5%, while the expanded unemployment rate worsened to 44.0%, driven by demographic expansion outstripping job creation and the near-total blowout of the economy’s traditional safety valves. Over the past year, the informal economy has shed an alarming 485,000 jobs (-12.2% YoY), while private household employment contracted by 68,000 in Q3 alone. Concurrently, primary agriculture shed 34,000 jobs (-3.6% QoQ), with skilled commercial agricultural employment plunging 47.5% YoY amidst emerging El Niño drought risks, depressed business confidence (RMB/BER BCI at 38), and looming trade headwinds from South Africa’s anticipated loss of AGOA market access after 1 January 2027. The attached opinion piece and press release provide an in-depth analysis of what these figures mean for investment strategy, business sentiment, and the structural reforms urgently required to avert deeper rural and informal displacement.
South Africa’s third-quarter 2026 employment figures offer a mixed picture: Manufacturing and Mining added jobs, and employment rose in several provinces, yet unemployment continued to climb and came in well above market expectations. With the working-age population also growing and global trade tensions, Middle East conflict and uncertainty over AGOA adding to the pressure, the latest data raise important questions about the pace and sustainability of job creation. Read the full report for a closer look at what’s driving the numbers, and which sectors and provinces may be most exposed.
With Botswana announcing plans to double its stake in De Beers from 15% to 30% alongside Anglo American’s historic disposal, we have published an executive analysis examining the investment calculus behind this landmark transaction: “Botswana Wants a Bigger Share of De Beers. But Is Bigger Ownership Always Better?” While securing a larger sovereign footprint reasserts domestic resource sovereignty, disciplined capital allocators must weigh whether Gaborone is acquiring a strategic bargain or dangerously compounding national exposure to an industry wrestling with structural disruptions from lab-grown synthetics and muted global luxury demand. Our piece breaks down how institutional investors should evaluate distressed commodity assets, the balance sheet realities of unlisted co-ownership, and what Anglo’s unbundling means for South African portfolios and regional SADC market confidence.
As global financial markets grapple with unprecedented concentration in a handful of mega-cap technology champions, our latest macroeconomic analysis, “The Nvidia Effect: When Global Markets Become Too Dependent on a Few Companies,” examines why uncertainty surrounding a single silicon powerhouse now exerts more systemic influence over global indices than traditional economic indicators. The piece explores how passive ETF capital flows mechanise market vulnerability, why shift-prone investor sentiment triggers severe multiple contractions even when corporate earnings fundamentals remain immaculate, and how South African investors taking capital offshore to hedge local risk have inadvertently fallen into a concentration trap by holding the exact same tech giants across different international feeder funds. We outline actionable, structural strategies for local wealth managers, institutional allocators, and individual investors to unbundle this risk and build authentic portfolio resilience.
The AGOA Reckoning: Weighing the Real Cost to Jobs, Industry, and the Fiscus Following the US administration’s confirmation that South Africa will be removed from the African Growth and Opportunity Act (AGOA) in January 2027, within a 60-day notice period, our latest economic analysis evaluates the severe consequences for the domestic economy. With an estimated 125,000 to 570,000 direct and indirect jobs now on the line, predominantly across automotive manufacturing in the Eastern Cape and agricultural fruit exports in the Western Cape, this trade shock hits an economy where unemployment already sits at an elevated 33.6% (43.8% expanded) and manufacturing contracted by 3.1% in Q2 2026. While Pretoria’s proposed “Plan B” seeks alternative export corridors via the Butterfly Strategy, it ignores the structural reality that Asian export powerhouses like China absorb raw mineral commodities rather than assembled finished goods, even as heavily subsidised Chinese imports continue to erode local industrial capacity. Left unaddressed, this loss of trade preference risks igniting a vicious fiscal transmission loop: triggering steep contractions in PAYE and VAT receipts, ballooning social grant expenditure, elevating sovereign borrowing, and driving up long-term bond yields at the very moment the fiscus was beginning to turn the corner. The attached comprehensive article and press release make the case for urgent, pragmatic economic diplomacy over political posturing to protect our industrial base and sovereign balance sheet.