

Manufacturing Production – September 2026
In September 2026, South Africa’s manufacturing output contracted by 3.5%, following the 4.1% contraction in August 2026. This decrease is notably worse than the 2.0% decrease analysts forecast for September 2026. During the same period, however, the Purchasing Managers’ Index (PMI) increased by 2.7 points, from 46.0 in June 2026 to 48.7 in September 2026. This indicates a cautious view of the business environment, with output contracting within the sector, while the sector-wide confidence level remained below the neutral mark of 50.0 index points.
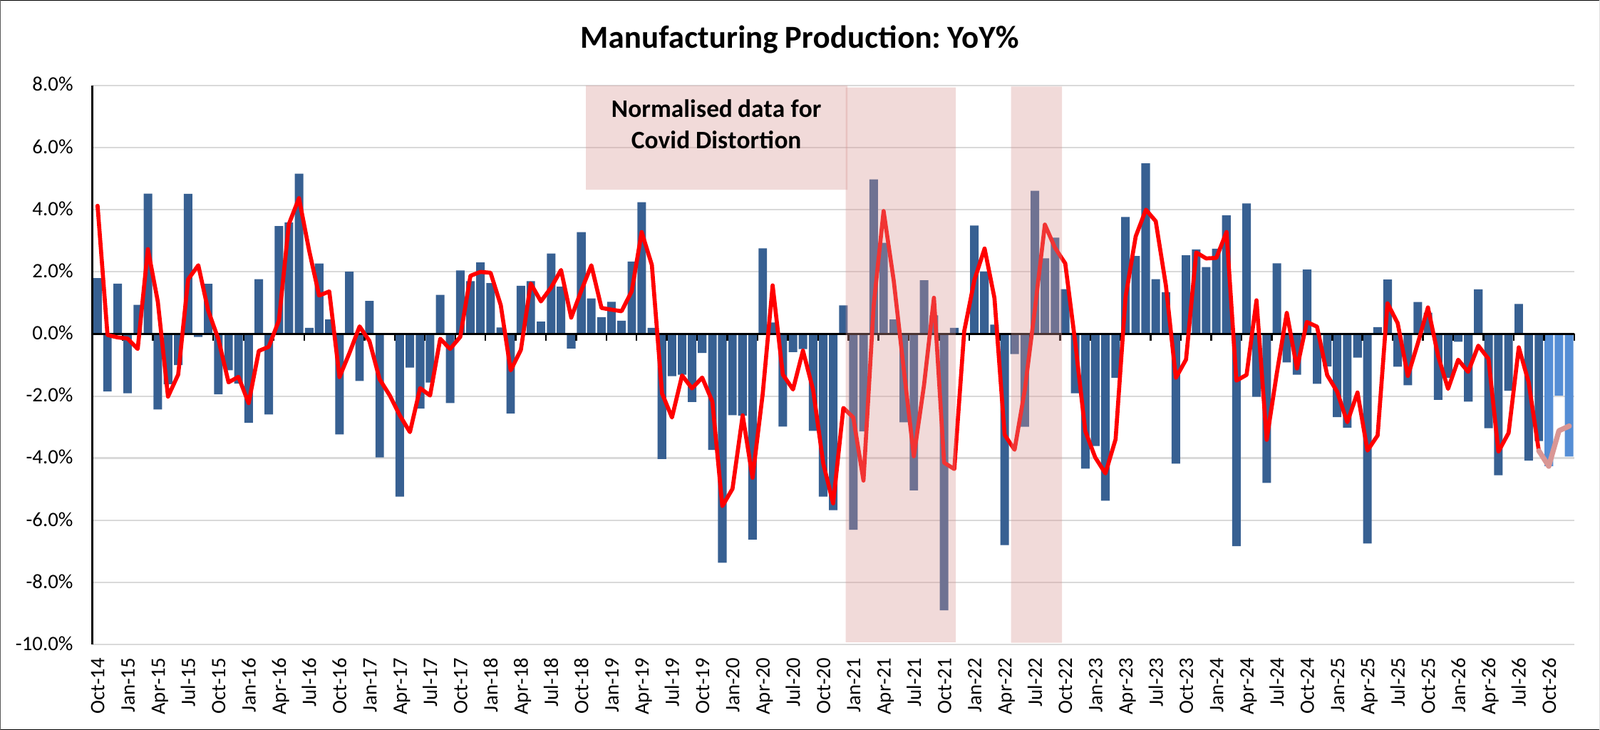
The decrease in manufacturing production during September was largely attributed to declines in:
- motor vehicles, parts and accessories and other transport equipment production, which decreased by 15.0% and subtracted 1.1 percentage points,
- wood and wood products, paper, publishing and printing that declined by 11.2% and which contributed -1.1 percentage points to output contraction,
- furniture and ‘other’ manufacturing production, which decreased by 19.0% and subtracted 0.8 percentage points, and
- basic iron and steel, non-ferrous metal products, metal products and machinery production, which decreased by 3.7% and subtracted 0.8 percentage points
| Division | Relative size | MoM% | YoY% | ||
|---|---|---|---|---|---|
| Aug-26 | Sept-26 | Aug-26 | Sept-26 | ||
| Radio, television and communication apparatus and professional equipment | 1.1% | 15.3% | 2.5% | 0.0% | −0.4% |
| Electrical machinery | 2.1% | −10.1% | 4.8% | −7.1% | 3.5% |
| Glass and non-metallic mineral products | 3.1% | −3.8% | 7.5% | −2.1% | 4.2% |
| Textiles, clothing, leather and footwear | 4.1% | −1.3% | −0.2% | 6.0% | 5.2% |
| Furniture and Other manufacturing groups | 4.2% | −8.6% | 2.2% | −17.7% | −24.9% |
| Motor vehicles, parts and accessories and other transport equipment | 8.7% | −4.3% | −11.6% | −8.9% | −15.0% |
| Wood and wood products, paper, publishing and printing | 10.5% | 6.3% | −3.6% | −7.0% | −11.2% |
| Basic iron and steel, non-ferrous metal products, metal products and machinery | 20.0% | −4.8% | 4.2% | −3.4% | −3.7% |
| Food and beverages | 21.4% | −5.1% | 10.8% | −1.3% | 0.4% |
| Petroleum, chemical products, rubber and plastic products | 24.9% | −1.0% | 4.0% | −4.9% | −0.4% |
| Total manufacturing production | 100.0% | −2.9% | 3.7% | −4.1% | −3.5% |
Seasonally adjusted manufacturing production for the third quarter of 2026 remained flat, with month-on-month changes of -3.0% and -2.1% for July and August, respectively. Out of ten sectors, five reported increases during this period. Significant contractions included:
- Food and beverage production, which increased by 4.9% and contributed +1.2 percentage point, and
- Higher output in basic iron and steel, non-ferrous metal products, metal products and machinery, which increased by 1.2% and contributed +0.3 points towards the contraction in manufacturing output for June.
Seasonally adjusted manufacturing sales increased by 3.2% during the third quarter of 2026. Significant increases were, however, recorded in:
- Petroleum, chemical products, rubber and plastic products division, which increased by 4.4%, adding 1.0 percentage points towards sales growth for the quarter.
- The motor vehicles, parts and accessories and other transport equipment division, which rose by 10.9%, added another 1.5 percentage points towards sales growth for the quarter under review, and
- Food and beverage sales, which increased by 3.4% and contributed +0.9 percentage point, and
| Division | R million | Relative size | MoM% | YoY% | |||
|---|---|---|---|---|---|---|---|
| Aug-26 | Sept-26 | Aug-26 | Sept-26 | Aug-26 | Sept-26 | ||
| Radio, television and communication apparatus and professional equipment | R2 580 207 | R2 699 250 | 0.9% | 1.4% | 4.6% | 5.0% | 11.5% |
| Textiles, clothing, leather and footwear | R7 015 810 | R6 938 103 | 2.2% | −1.9% | −1.1% | 3.5% | 4.7% |
| Electrical machinery | R6 970 364 | R7 174 461 | 2.6% | −3.2% | 2.9% | 2.5% | 9.4% |
| Glass and non-metallic mineral products | R8 798 911 | R9 086 314 | 2.8% | −1.2% | 3.3% | 1.2% | 7.4% |
| Furniture and Other manufacturing groups | R9 039 517 | R8 945 691 | 3.0% | −2.0% | −1.0% | −2.4% | −15.4% |
| Wood and wood products, paper, publishing and printing | R17 717 059 | R15 817 237 | 6.4% | −1.6% | −10.7% | −1.1% | −11.4% |
| Motor vehicles, parts and accessories and other transport equipment | R48 426 131 | R42 483 844 | 16.9% | 7.6% | −12.3% | 10.4% | −6.0% |
| Petroleum, chemical products, rubber and plastic products | R67 460 206 | R67 982 088 | 20.2% | 4.3% | 0.8% | 8.3% | 7.9% |
| Basic iron and steel, non-ferrous metal products, metal products and machinery | R57 740 999 | R58 264 123 | 21.2% | 0.0% | 0.9% | −0.4% | 1.2% |
| Food and beverages | R75 969 330 | R75 606 477 | 23.8% | −2.0% | −0.5% | 0.1% | −0.1% |
| Total value of manufacturing sales | R303 707 095 | R297 012 031 | 100.0% | 1.3% | −2.2% | 3.4% | 0.4% |
Manufacturing remains a cornerstone of the South African economy, sustaining roughly 1.57 million jobs and contributing 12.5% to GDP in 2025. However, the sector faces mounting pressure. Headcount increased slightly from 1.571 million in Q2 2026 to 1.604 million in Q3 2026. Lower production volumes, as seen in the latest manufacturing data released by STATSSA, indicate that the trade tariffs imposed by the United States since August 2025 have severely strained the sector, eroding price competitiveness in the US market as tariff-driven duties inflate landed costs for local exporters.
The increase in employment in this sector comes as a welcome surprise, while the decrease in output underscores how these market-access hurdles are filtering through to headline growth and labour absorption across the broader industrial base. Notably, South African exports to the US have plummeted by 56% since 2025, driven by trade friction, tariff barriers, and diplomatic strains between Pretoria and Washington.
Consequently, manufacturer sentiment has remained below the critical 50-point index mark for September, echoing the cautious approach South African manufacturers are adopting amid higher tariffs and reduced market access in the US. Despite these headwinds, South African corporates continue to bolster their balance sheets. South African Reserve Bank data reveal that private-sector cash holdings reached approximately R1.8 trillion in Q2 2026, up sharply from R1.1 trillion in Q1 2025, demonstrating a defensive, capital-preservation posture amid short- to medium-term global and domestic volatility.


